03. Finding the Lines: Histogram Peaks
Locate the Lane Lines
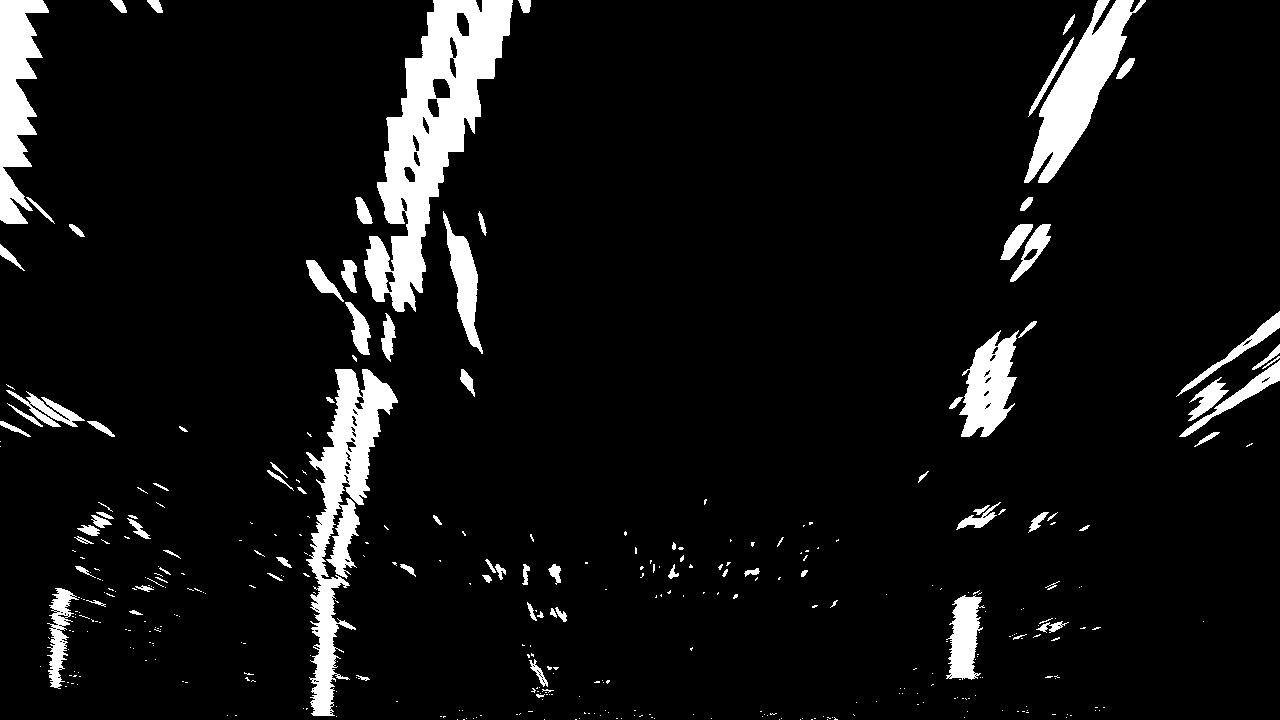
Thresholded and perspective transformed image
You now have a thresholded warped image and you're ready to map out the lane lines! There are many ways you could go about this, but here's one example of how you might do it:
** Line Finding Method: Peaks in a Histogram**
After applying calibration, thresholding, and a perspective transform to a road image, you should have a binary image where the lane lines stand out clearly. However, you still need to decide explicitly which pixels are part of the lines and which belong to the left line and which belong to the right line.
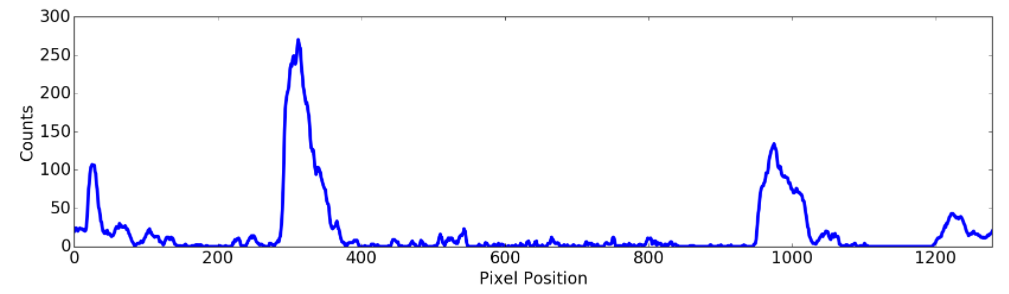
Plotting a histogram of where the binary activations occur across the image is one potential solution for this. In the quiz below, let's take a couple quick steps to create our histogram!
Start Quiz:
Here's the approach I took.
I take a histogram along all the columns in the lower half of the image like this:
import numpy as np
import matplotlib.pyplot as plt

histogram = np.sum(img[img.shape[0]//2:,:], axis=0)
plt.plot(histogram)
The result looks like this:
Sliding Window
With this histogram we are adding up the pixel values along each column in the image. In our thresholded binary image, pixels are either 0 or 1, so the two most prominent peaks in this histogram will be good indicators of the x-position of the base of the lane lines. We can use that as a starting point for where to search for the lines. From that point, we can use a sliding window, placed around the line centers, to find and follow the lines up to the top of the frame.
Here is a short animation (no sound!) showing this method:
Finding Lane Pixels by Histogram and Sliding Window